Apps
Manage your deployed applications — start, stop, reload, scale, and monitor.
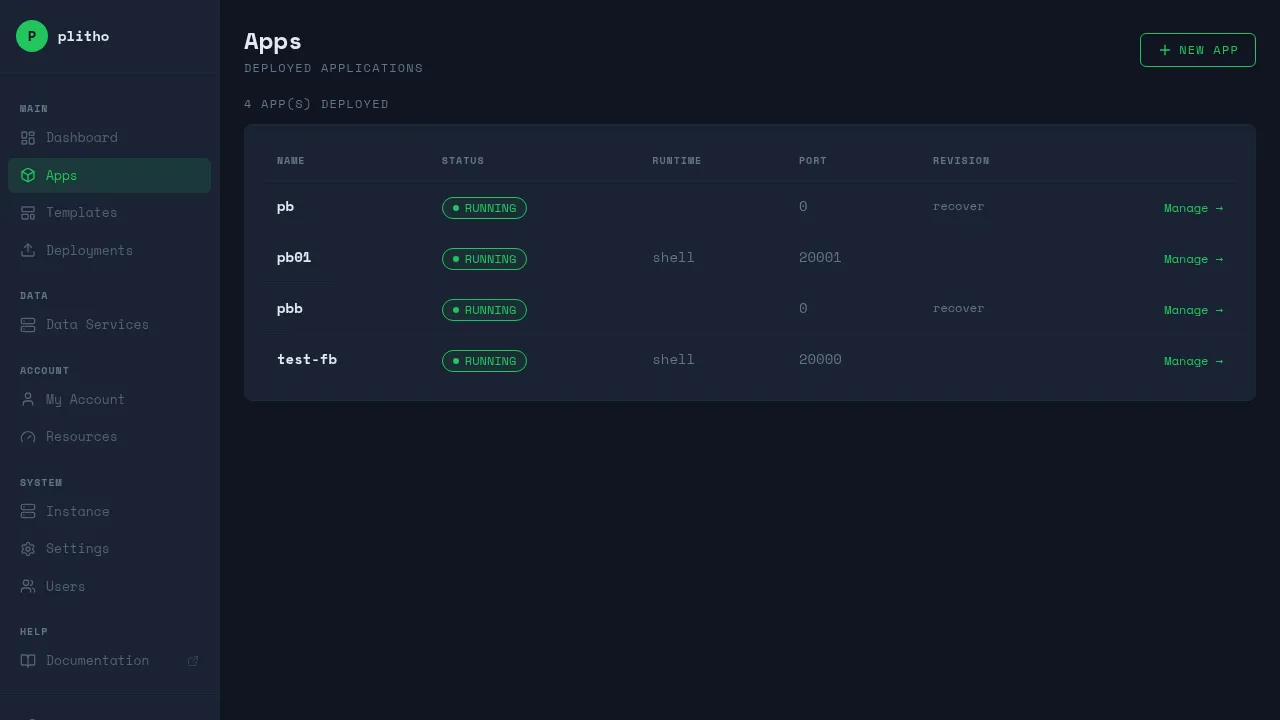
Apps List
The Apps page shows all your deployed applications.
| Column | Description |
|---|---|
| Name | App name (matches plitho.yml name) |
| Status | RUNNING, STOPPED, or DEPLOYING |
| Runtime | node, python, static, or shell |
| Port | The port the app listens on |
| Revision | Git commit hash (first 7 chars) |
Creating an App
- Go to Apps → NEW APP
- Enter a name for your app
- Click CREATE APP
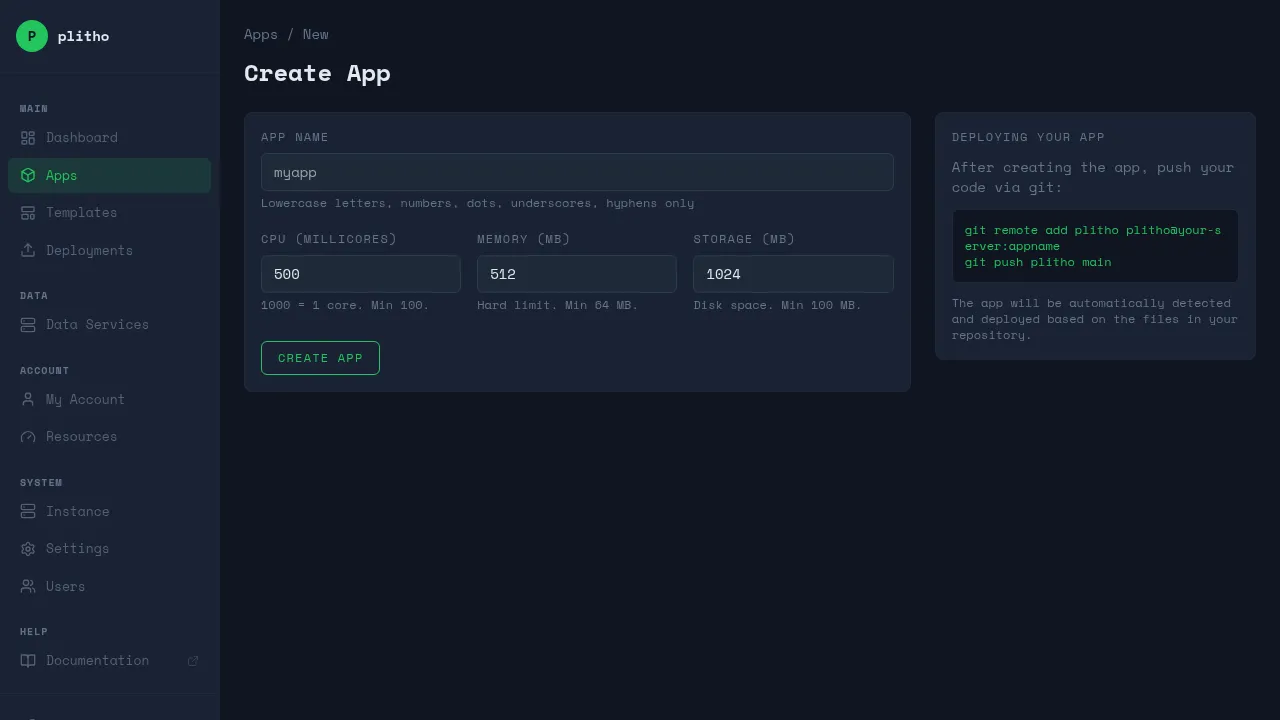
This creates a git remote. Add it to your repo:
git remote add plitho ssh://plitho@your-server:2222/myappname
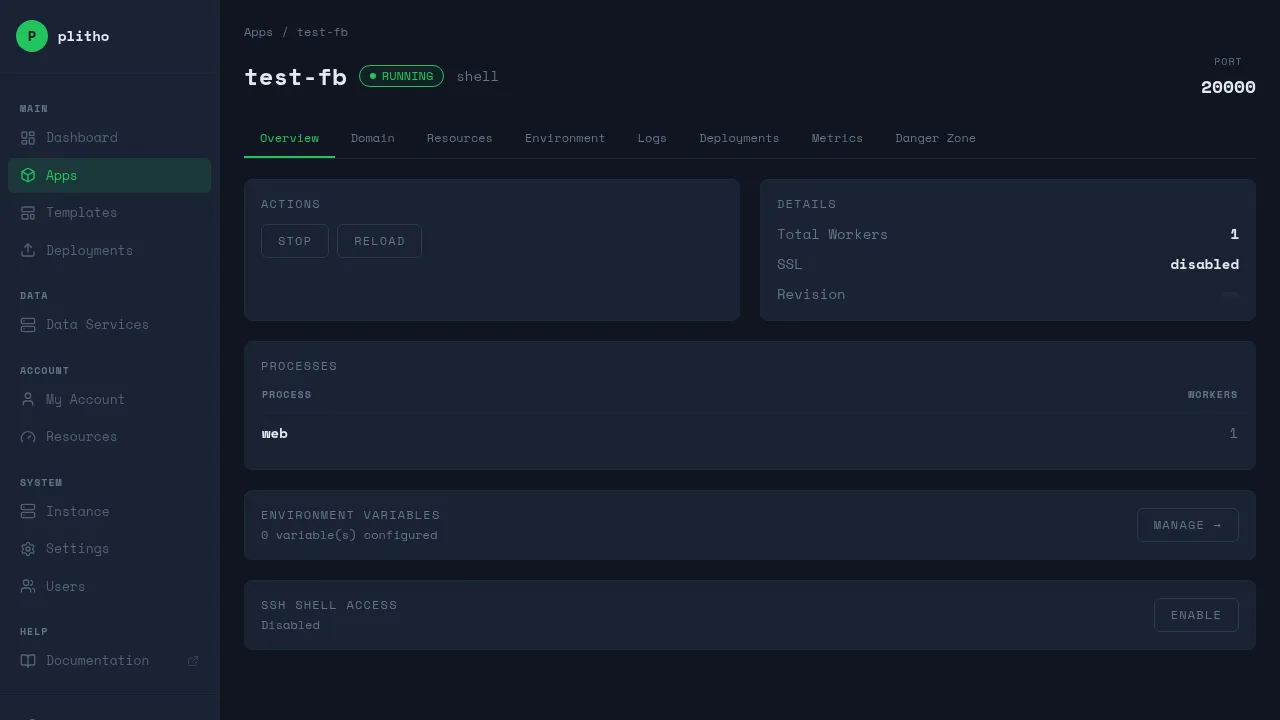
App Detail
Click Manage on any app to see its detail page.
Tabs
| Tab | What's there |
|---|---|
| Overview | App status, actions, process info |
| Domain | Custom domains and SSL |
| Resources | CPU and memory limits |
| Environment | Environment variables |
| Logs | Real-time log streaming |
| Deployments | Deployment history |
| Metrics | CPU and memory usage charts |
| Danger Zone | Delete app |
Actions
| Action | What it does |
|---|---|
| Stop | Stops the app process |
| Start | Starts or redeploys the app |
| Reload | Restarts the app process without a full redeploy |
How Processes Work
Each app can have multiple process types. The most common is web (HTTP-facing), but you can also run worker processes for background tasks.
Web Process
The web process is your HTTP server. It receives traffic from nginx.
apps:
  - name: myapp
    process:
      web:
        cmd: node server.js
        server_port: 3000
Key details:
- Only the
webprocess gets a port assigned - nginx proxies traffic to this port
- If no
server_portis specified, Plitho auto-assigns one from 20000-30000 - The port is stored and reused across deploys
Worker Process
Worker processes run background tasks. They don't receive HTTP traffic.
apps:
  - name: myapp
    process:
      web:
        cmd: node server.js
        server_port: 3000
      worker:
        cmd: node worker.js
        workers: 2
Key details:
- Workers don't get a port
- They run the same command multiple times if
workers > 1 - Useful for job queues, cron workers, background processing
Cron Process
Cron processes run on a schedule. The cmd is a cron expression followed by the command.
apps:
  - name: myapp
    process:
      web:
        cmd: node server.js
        server_port: 3000
      cron:
        cmd: "0 * * * * node cleanup.js"
Key details:
- Only one cron worker is allowed (workers is always 1)
- The cmd must be a valid cron expression followed by the command
- Format:
minute hour day-of-month month day-of-week command
Disabling Processes
You can disable specific processes:
apps:
  - name: myapp
    process:
      web:
        cmd: node server.js
        server_port: 3000
      worker:
        cmd: node worker.js
        enabled: false
Scaling
Scale the number of workers for a process:
ssh -p 2222 plitho@your-server scale myapp web=4
Or via the API:
curl -X POST https://your-server/api/apps/myapp/scale?web=4
Key details:
- Scaling affects the number of systemd service instances
- Each worker gets its own process
- The
webprocess shares the same port (nginx load-balances) - Scaling is persisted across deploys
Port Management
Auto-Assignment
When server_port is omitted, Plitho auto-assigns a port from 20000-30000. The port is:
- Assigned once and reused across deploys
- Stored in the database
- Injected as the
PORTenvironment variable - Used in the nginx proxy config
Explicit Ports
You can specify a port explicitly:
apps:
  - name: myapp
    process:
      web:
        cmd: node server.js
        server_port: 3000
Key details:
- Plitho checks for port collisions before starting
- If the port is taken, the deploy fails with an error
- The port must be in the range 1-65535
Port Ranges
| Resource | Range | Notes |
|---|---|---|
| Apps | 20000-30000 | Auto-assigned or explicit |
| Valkey | 6379+ | Auto-assigned |
| Data services | 30000+ | Type-specific ranges |
Logs
View real-time logs from your app:
- Go to your app → Logs tab
- Logs stream automatically
- Use the filter to search output
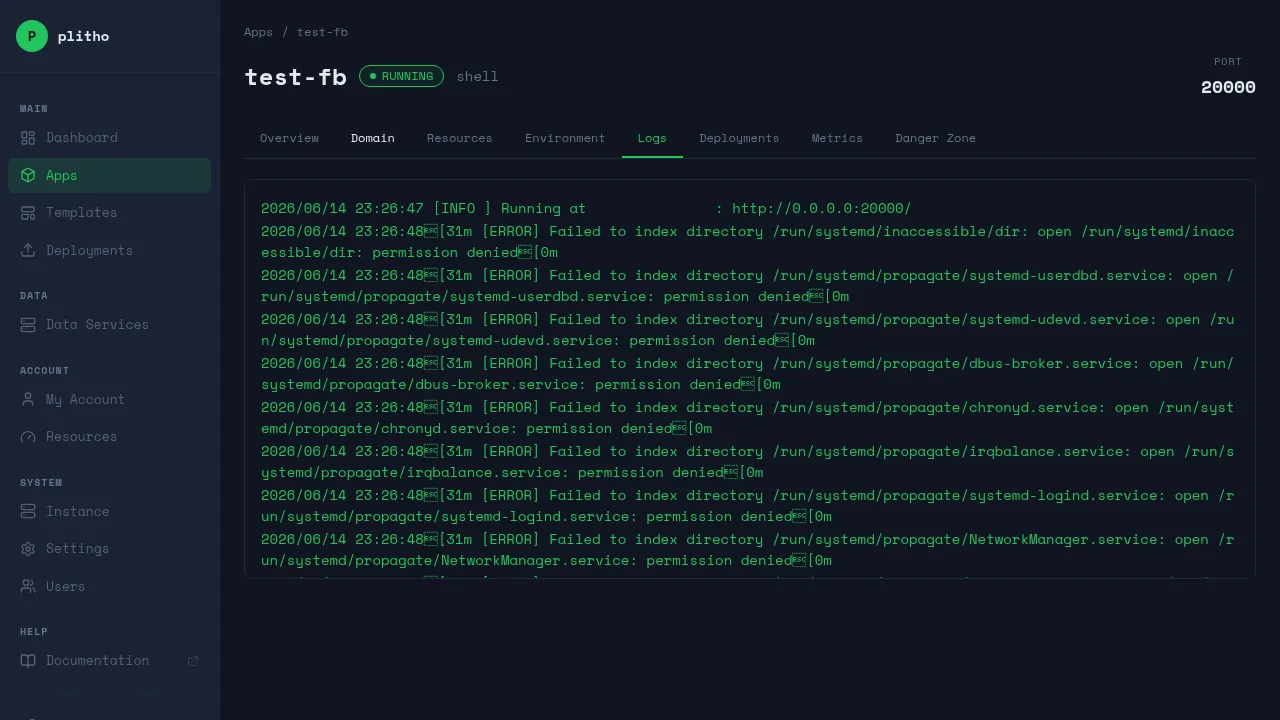
Logs survive redeployments — you can always see what your app outputted.
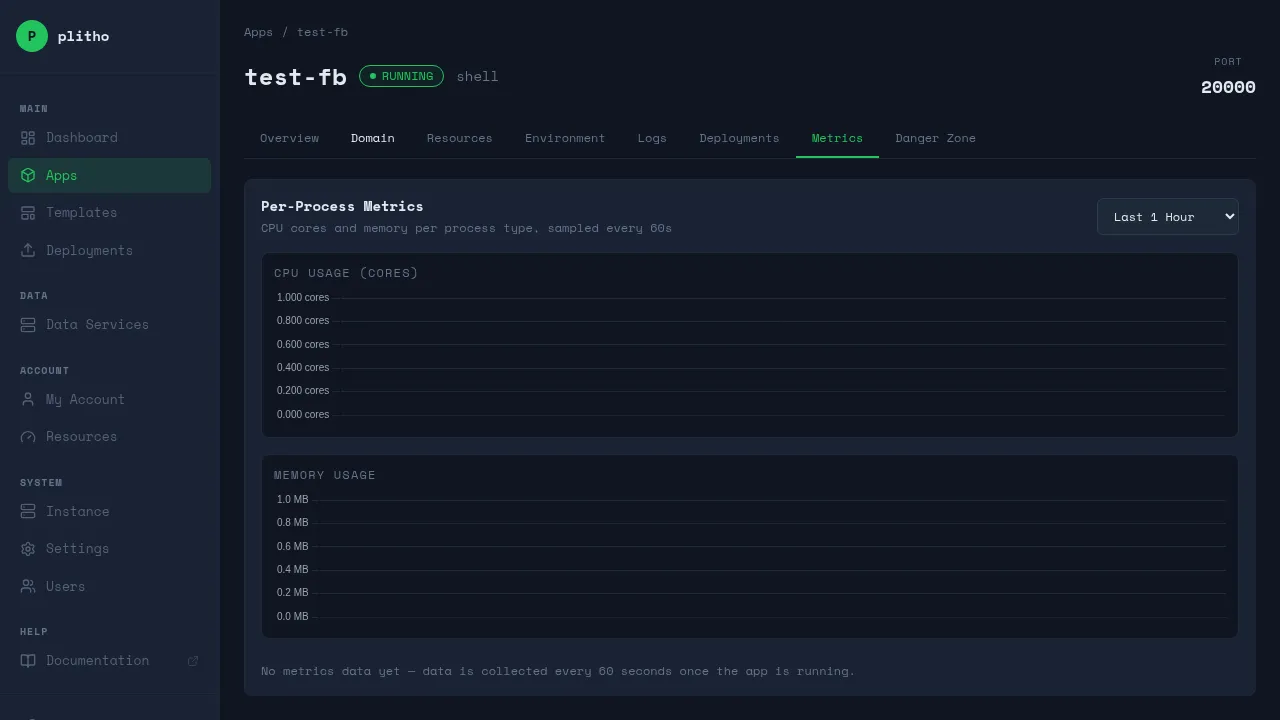
Metrics
View CPU and memory usage over time:
- Go to your app → Metrics tab
- Select a time range (1 hour, 6 hours, 24 hours, 7 days, 30 days)
- View per-process charts
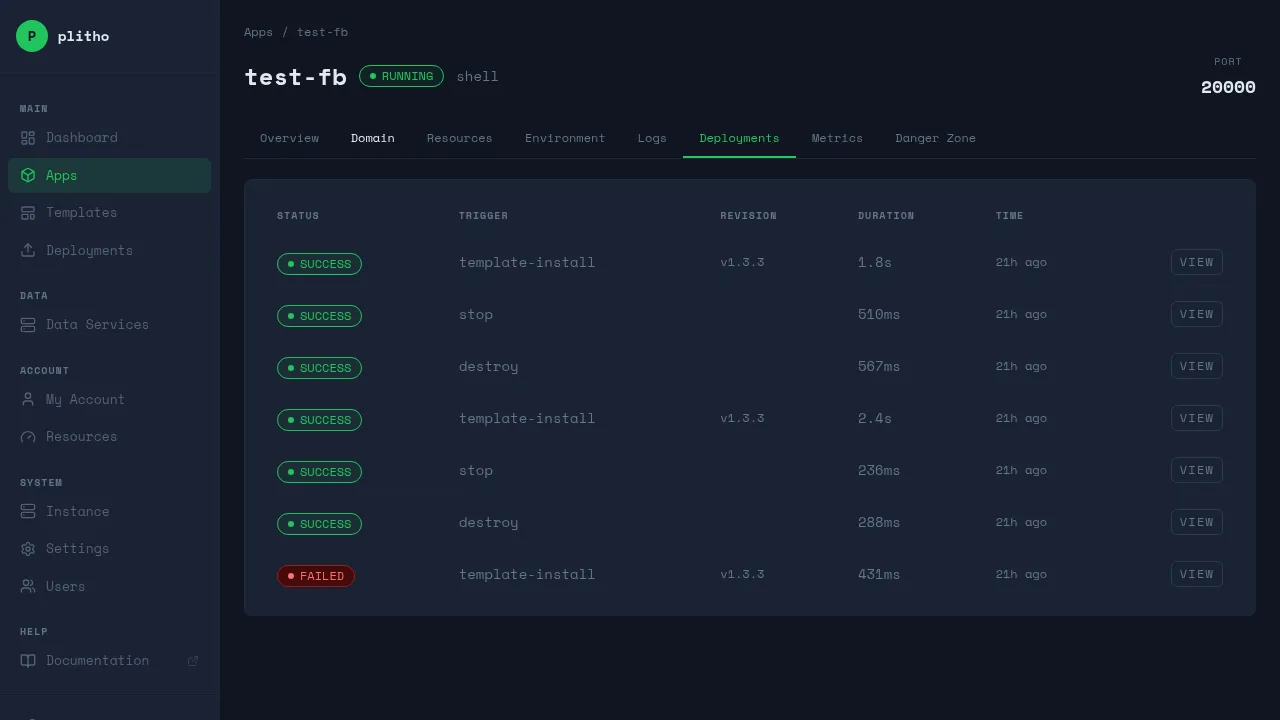
Deployment History
View past deployments:
- Go to your app → Deployments tab
- See deployment status, timestamp, and revision
- Click on a deployment to see detailed events
Persistent Data
Your app has a persistent data/ directory that survives redeployments. Use it for:
- Uploaded files
- SQLite databases
- Cache files
- Any data that shouldn't be lost on deploy
Access it in your app code as the current working directory, or via SSH.
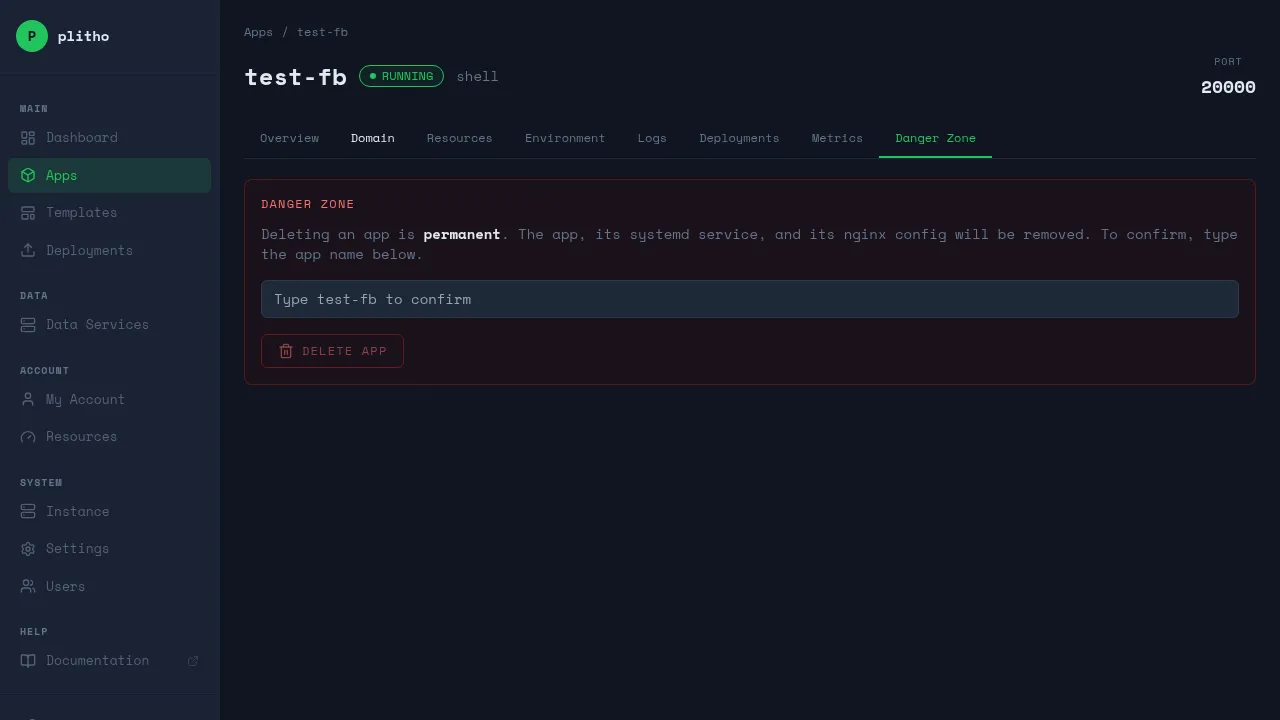
Deleting an App
Danger
This permanently deletes the app, its git repository, and all data.
- Go to your app → Danger Zone tab
- Click Delete
- Confirm